Installing SBGrid Software
Using the SBGrid Environment
Support for Site Administrators
Hardware Support Notes
Getting Help
Support for Developers
The majority of structural biology computing happens on linux; there are several vendors providing linux workstation or server configurations we've had good experience with: ThinkMate, Exxact, Microway. Please feel free to contact us at help@sbgrid.org regarding upcoming hardware, or if you have another hardware vendor to mention.
System configurations can be targeted to particular compute-intenstive workflows (for example, Cryo-EM or small molecule docking). We're in the process of assembling benchmark workflows, datasets and results to help guide hardware decisions.
Any Apple machine can be a capable computer for structural biology. The basic Apple educational discount is available through their online web store, and your institution may have negotiated an arrangement with their Apple representative. SBGrid has several labs that run exclusively on Macs and OS X, though these are not advised for CryoEM data processing.
| System | Hardware Overview | GPU model | GPU count | GPU release date | 2022 current approximate GPU Cost |
|---|---|---|---|---|---|
| Single Workstation | 8x Xeon E5-1630 v4 @3.7GHz ; 128G RAM ; 1G network | GeForce RTX 2080 | 1 | 2018/09 | 650 |
| Cryo-EM Cluster Node 1 | 2x 16 core Xeon(R) Gold 6142 @2.6GHz ; 384G RAM ; 10G network | 1080 Ti | 7 | 2017/03 | 450 |
| Cryo-EM Cluster Node 2 | 2x Xeon(R) Gold 6226R @2.9GHz ; 384G RAM ; 10G network | 2080 Ti | 4 | 2018/09 | 650 |
| Cryo-EM Cluster Node 3 | AMD EPYC 7542 @2.9GHz ; 512G RAM ; 10G network | RTX6000 | 4 | 2018/08 | 4000 |
| Cryo-EM Cluster Node 4 | Xeon(R) E5-2698 v4 @2.2GHz ; 503G RAM ; 50G network | Tesla V100-SXM2 | 8 | 2018/03 | 9000 |
| AWS (g5.4xlarge) | AMD EPYC 7R32 ; 64G RAM ; 10G (burstable) network | NVIDIA A10G Tensor | 1 | 2021/04 | N/A |
| AWS Instance Type | Hardware Overview | GPU model | GPU count | GPU release date | hourly cost |
|---|---|---|---|---|---|
| g4dn.2xlarge | 8x Xeon(R) Platinum 8259CL CPU @ 2.50GHz ; 32GB RAM | T4 Tensor Core | 1 | 2018/09 | $0.75 |
| g4dn.8xlarge | 32x Xeon(R) Platinum 8259CL CPU @ 2.50GHz ; 128GB RAM | T4 Tensor Core | 1 | 2018/09 | $2.18 |
| g4dn.12xlarge | 48x Xeon(R) Platinum 8259CL CPU @ 2.50GHz ; 192GB RAM | T4 Tensor Core | 4 | 2018/09 | $3.91 |
| g4dn.metal | 96x Xeon(R) Platinum 8259CL CPU @ 2.50GHz ; 384GB RAM | T4 Tensor Core | 8 | 2018/09 | $7.82 |
| g5.2xlarge | 8x AMD EPYC 7R32; 32GB RAM | A10G Tensor Core | 1 | 2021/04 | $1.21 |
| g5.16xlarge | 64x AMD EPYC 7R32; 256GB RAM | A10G Tensor Core | 1 | 2021/04 | $4.10 |
| g5.12xlarge | 48x AMD EPYC 7R32; 192GB RAM | A10G Tensor Core | 4 | 2021/04 | $5.67 |
| g5.24xlarge | 96X AMD EPYC 7R32; 384GB RAM | A10G Tensor Core | 4 | 2021/04 | $8.14 |
Core counts determined via nproc output, and include hyperthreading where enabled.
Network capacity on AWS instances may not be directly comparable to physical systems.
| Dataset | Number of Images | Storage Space |
|---|---|---|
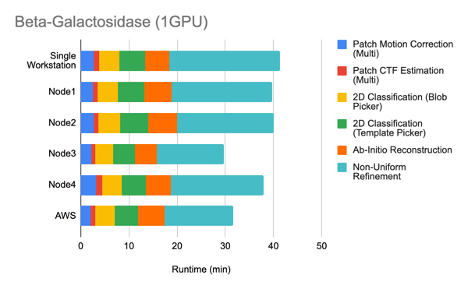
| Beta-Galactosidase | 24 | 3.0G |
| Cannabinoid Receptor 1-G Protein Complex | 2753 | 476G |
| Inflammasome | 6594 | 1.6T |
Beta-galactosidase data set from the Namba group at Osaka University, Japan. (EMPIAR-10204, EMD-6840); courtesy of the Relion tutorial. It was collected on a JEOL CRYO ARM 200 microscope.
Cannabinoid receptor 1-G Protein complex data set from Kumar et al. (EMPIAR-10288, EMD-0339, PDB-6n4b); courtesy of the Skiniotis group at Stanford University via the CryoSPARC tutorial. It was collected on a FEI Titan Krios microscope.
Inflammasome data set from Sharif et al. (EMPIAR-10597, EMD-22367, PDB-7jkq); courtesy of the Wu group at Harvard University. It was collected on a FEI Titan Krios microscope.
Current benchmarking workflows run with cryosparc 3.3.2
Single GPU performance:
Multi-GPU performance:

Multi-GPU Relative Runtime vs Ideal Case:

Ideal relative speed-up calculated as 1/number of GPUs.
Single GPU performance:

Multi-GPU performance:

Multi-GPU Relative Runtime vs Ideal Case:

Ideal relative speed-up calculated as 1/number of GPUs.
Single GPU performance vs 2022 GPU Cost:


Green line showing linear fit.

Green line showing linear fit.
Page edited by: Bojia Cynthia Hu, Grinnell College, Student of the 2022 Summer Scholars Program at Harvard Medical School